Appium Bootcamp – Chapter 4: Your First Test

appium_logoThis is the fourth post in a series called Appium Bootcamp by noted Selenium expert Dave Haeffner. Click the links to read the firstsecond, and third posts. 

Dave recently immersed himself in the open source Appium project and collaborated with leading Appium contributor Matthew Edwards to bring us this material. Appium Bootcamp is for those who are brand new to mobile test automation with Appium. No familiarity with Selenium is required, although it may be useful. This is the fourth of eight posts; two new posts will be released each week.

There are a good deal of similarities between Selenium and Appium tests. We will be using similar actions (like click) along with some kind of wait mechanism (e.g., an explicit wait) to make our tests more resilient. There will also be an assertion used to determine if our actions were successful or not.

In order to put these concepts to work, let’s consider the basic structure of the test apps we’ve been working with. They are straightforward in that they both have text elements that, when clicked, take you to a dedicated page for that element (e.g., Accessibility triggers the Accessibility page). Let’s step through our first set of test actions (in the console) that we’ll use to automate this behavior; verifying that each element brings us to the correct page.

Let’s dig in with some examples.

An iOS Example

The behavior of our app can be easily mapped to test actions by first using a text match to find the element we want, and clicking it. We can then make sure we are in the right place by performing another text match (this time an exact text match). When we wire this up to our test framework, this match will be responsible for passing or failing the test. More on that in the next post.

text('Buttons, Various uses of UIButton').click
text_exact 'Buttons'

The only problem with this approach is that it is not resilient. The global wait for each test action (a.k.a. an implicit wait) is set to 0 seconds by default. So if there is any delay in the app, the test action will not complete and throw an element not found exception instead.

To overcome these timing problems we can employ an explicit wait around our test actions (both the click and the exact text match). This is simple enough to do with the wait command.

wait { text('Buttons, Various uses of UIButton').click }
wait { text_exact 'Buttons' }

These test actions are resilient now, but they’re inflexible since we were using statically coded values. Let’s fix that by using dynamic values instead.

cell_1 = wait { text 2 }
cell_title = cell_1.name.split(',').first

wait { cell_1.click }
wait { text_exact cell_title }

Now we’re finding the first text by it’s index. Index 2 contains the first element (a.k.a. a cell), whereas index 1 is the table header. After that, we’re extracting the name and dynamically finding the title. Now our test will continue to work if there are any text changes.

This is good, but now let’s expand things to cover the rest of the app.

cell_names = tags('UIATableCell').map { |cell| cell.name }

cell_names.each do |name|
  wait { text_exact(name).click }
  wait { text_exact name.split(',').first }
  wait { back }
end

We first grab the names of each clickable cell, storing them in a collection. We then iterate through the collection, finding each element by name, clicking it, performing an exact match on the resulting page, and then going back to the main screen. This is repeated until each cell is verified.

This works for cells that are off the screen (e.g., out of view) since Appium will scroll them into view before taking an action against them.

An Android Example

Things are pretty similar to the iOS example. We perform a text match, click action, and exact text match.

text('Accessibility').click
text_exact 'Accessibility Node Provider'

We then make things resilient by wrapping them in an explicit wait.

wait { text('Accessibility').click }
wait { text_exact 'Accessibility Node Provider' }

We then make our selection more flexible by upgrading to dynamic values.

cell_1 = wait { text 2 }

wait { cell_1.click }
wait { find_exact 'Accessibility Node Provider' }

We then expand things to exercise the whole app by collecting all of the clickable elements and iterating through them.

cell_names = tags('android.widget.TextView').map { |cell| cell.name }

cell_names[1..-1].each do |cell_name|
  wait { scroll_to_exact(cell_name).click }
  wait_true { ! exists { find_exact cell_name } }
  wait { back }
  wait { find_exact('Accessibility'); find_exact('Animation')  }
end

A few things to note.

The first item in the cell_names collection is a header. To discard it, we use cell_name[1..-1] which basically says start with the second item in the collection (e.g., [1) and continue (e.g., ..) all the way until the end (e.g.,-1]).

In order to interact with cells that are off the screen, we will need to use the scroll_to_exact command, and perform a click against that (instead of a text match).

Since each sub-screen doesn’t have many unique attributes for us to verify against, we can at the very least verify that we’re no longer on the home screen. After that, we verify that we are brought back to the home screen.

Outro

Now that we have our test actions sussed out, we’re ready to commit them to code and plug them into a test runner.

Read:  Chapter 1 | Chapter 2 | Chapter 3

About Dave Haeffner: Dave is a recent Appium convert and the author of Elemental Selenium (a free, once weekly Selenium tip newsletter that is read by thousands of testing professionals) as well as The Selenium Guidebook (a step-by-step guide on how to use Selenium Successfully). He is also the creator and maintainer of ChemistryKit (an open-source Selenium framework). He has helped numerous companies successfully implement automated acceptance testing; including The Motley Fool, ManTech International, Sittercity, and Animoto. He is a founder and co-organizer of the Selenium Hangout and has spoken at numerous conferences and meetups about acceptance testing.

Follow Dave on Twitter – @tourdedave


Sign Up for the First-Ever Appium Roadshow on August 20th in New York City

appium_logoWe don’t know if you heard, but mobile is kind of a big deal.

Naturally, Appium – the only open source, cross-platform test automation tool for native, hybrid, and mobile web apps – emerged out of the need to Test All The (Mobile) Things.  Last May, battle-tested Appium 1.0 was released, and now this Appium show is hitting the road!

Details and ticket links below. Hope to see you in New York!

*****

Sign Up for the First-Ever Appium Roadshow on August 20th

Appium Roadshow – NYC is a two part, day-long event held on Wednesday, August 20 at Projective Space – LES in Manhattan’s Lower East Side.

Part 1 – Appium in the Wild

8:30 AM – 1:00 PM – Free

The morning session will showcase presentations from Gilt Groupe, Sharecare, Softcyrlic, and Sauce Labs. Topics will cover real-world examples, lessons learned, and best practices in mobile app test automation using Appium. Featured speakers include:

  • Matthew Edwards – Mobile Automation Lead, Aquent
  • Daniel Gempesaw – Software Testing Architect, Sharecare
  • Matt Isaacs – Engineer, Gilt Groupe
  • Jonathan Lipps – Director of Ecosystem and Integrations, Sauce Labs
  • Sundar Sritharan – Delivery Manager, Softcrylic

This event is free. Breakfast and lunch included. Reserve your seat now – register here.

Part 2 – Appium Workshop

1:30 PM – 5:30 PM – $100

Matthew Edwards, a leading contributor to the Appium project, will provide a hands-on workshop to help you kick start your Appium tests.  He’ll talk you through how to set up the environment needed for native iOS and Android automation with Ruby.  You’ll then download and configure the Appium.app to enable test writing. Then, Matthew will demonstrate how to kick up an Appium server and then run a test.

This event is limited to just 40 participants. Reserve your seat now – register here.


Appium Bootcamp – Chapter 3: Interrogating Your App

appium_logoThis is the third post in a series called Appium Bootcamp by noted Selenium expert Dave Haeffner. Click the links to read the first and second posts. 

Dave recently immersed himself in the open source Appium project and collaborated with leading Appium contributor Matthew Edwards to bring us this material. Appium Bootcamp is for those who are brand new to mobile test automation with Appium. No familiarity with Selenium is required, although it may be useful. This is the third of eight posts; a new post will be released each week.

Writing automated scripts to drive an app in Appium is very similar to how it’s done in Selenium. We first need to choose a locator, and use it to find an element. We can then perform an action against that element.

In Appium, there are two approaches to interrogate an app to find the best locators to work with. Through the Appium Console, or through an Inspector (e.g., Appium Inspector, uiautomatorviewer, or selendroid inspector).

Let’s step through how to use each of them to decompose and understand your app.

Using the Appium Console

Assuming you’ve followed along with the last two posts, you should have everything setup and ready to run.

Go ahead and startup your Appium server (by clicking Launch in the Appium GUI) and start the Appium Ruby Console (by running arc in a terminal window that is in the same directory as your appium.txt file). After it loads you will see an emulator window of your app that you can interact with as well as an interactive prompt for issuing commands to Appium.

The interactive prompt is where we’ll want to focus. It offers a host of readily available commands to quickly give us insight into the elements that make up the user interface of the app. This will help us easily identify the correct locators to automate our test actions against.

The first command you’ll want to know about is page. It gives you access to every element in the app. If you run it by itself, it will output all of the elements in the app, which can be a bit unwieldy. Alternatively you can specify additional arguments along with it. This will filter the output down to just a subset of elements. From there, there is more information available that you can use to further refine your results.

Let’s step through some examples of that and more for both iOS and Android.

An iOS Example

To get a quick birds eye view of our iOS app structure, let’s get a list of the various element classes available. With the page_class command we can do just that.

[1] pry(main)> page_class
get /source
13x UIAStaticText
12x UIATableCell
4x UIAElement
2x UIAWindow
1x UIATableView
1x UIANavigationBar
1x UIAStatusBar
1x UIAApplication

UIAStaticText and all of the others are the specific class names for types of elements in iOS. You can see reference documentation for UIAStaticText here. If you want to see the others, go here.

With the page command we can specify a class name and see all of the elements for that type. When specifying the element class name, we can either specify it as a string, or a symbol (e.g., 'UIAStaticText' or:UIAStaticText).

[2] pry(main)> page :UIAStaticText
get /context
post /execute
{
    :script => "UIATarget.localTarget().frontMostApp().windows()[0].getTree()"
}
UIAStaticText
   name, label, value: UICatalog
UIAStaticText
   name, label: Buttons, Various uses of UIButton
   id: ButtonsTitle   => Buttons
       ButtonsExplain => Various uses of UIButton
UIAStaticText
   name, label: Controls, Various uses of UIControl
   id: ControlsExplain => Various uses of UIControl
       ControlsTitle   => Controls
UIAStaticText
   name, label: TextFields, Uses of UITextField
   id: TextFieldExplain => Uses of UITextField
       TextFieldTitle   => TextFields
...

Note the get and post (just after we issue the command but before the element list). It is the network traffic that is happening behind the scenes to get us this information from Appium. The response to post /execute has a script string. In it we can see which window this element lives in (e.g., windows()[0]).

This is important because iOS has the concept of windows, and some elements may not appear in the console output even if they’re visible to the user in the app. In that case, you could list the elements in other pages (e.g.,page window: 1). 0 is generally the elements for your app, whereas 1 is where the system UI lives. This will come in handy when dealing with alerts.

Finding Elements

Within each element of the list, notice their properties — things like namelabelvalue, and id. This is the kind of information we will want to reference in order interact with the app.

Let’s take the first element for example.

UIAStaticText
   name, label, value: UICatalog

In order to find this element and interact with it, we can can search for it with a couple of different commands: findtext, or text_exact.

> find('UICatalog')
...
#
> text('UICatalog')
...
#
> text_exact('UICatalog')
...
#

We’ll know that we successfully found an element when we see a Selenium::WebDriver::Element object returned.

It’s worth noting that in the underlying gem that enables this REPL functionality, if we end our command with a semi-colon it will not show us the return object.

> find('UICatalog')
# displays returned value

> find('UICatalog');
# returned value not displayed

To verify that we have the element we expect, let’s access the name attribute for it.

> find('UICatalog').name
...
"UICatalog"

Finding Elements by ID

A better approach to find an element would be to reference its id, since it is less likely to change than the text of the element.

UIAStaticText
   name, label: Buttons, Various uses of UIButton
   id: ButtonsTitle   => Buttons
       ButtonsExplain => Various uses of UIButton

On this element, there are some IDs we can reference. To find it using these IDs we can use the id command. And to confirm that it’s the element we expect, we can ask it for its name attribute.

> id('ButtonsTitle').name
...
"Buttons, Various uses of UIButton"

For a more thorough walk through and explanation of these commands (and some additional ones) go here. For a full list of available commands go here.

An Android Example

To get a quick birds eye view of our Android app structure, let’s get a list of the various element classes available. With the page_class command we can do just that.

[1] pry(main)> page_class
get /source
12x android.widget.TextView
1x android.view.View
1x android.widget.ListView
1x android.widget.FrameLayout
1x hierarchy

android.widget.TextView and all of the others are the specific class names for types of elements in Android. You can see reference documentation for TextView here. If you want to see the others, simply do a Google search for the full class name.

With the page command we can specify a class name and see all of the elements for that type. When specifying the element class name, we can specify it as a string (e.g., 'android.widget.TextView').

[2] pry(main)> page 'android.widget.TextView'
get /source
post /appium/app/strings

android.widget.TextView (0)
  text: API Demos
  id: android:id/action_bar_title
  strings.xml: activity_sample_code

android.widget.TextView (1)
  text, desc: Accessibility
  id: android:id/text1

android.widget.TextView (2)
  text, desc: Animation
  id: android:id/text1
...

Note the get and post (just after we issue the command but before the element list). It is the network traffic that is happening behind the scenes to get us this information from Appium. get /source is to download the source code for the current view and post /appium/app/strings gets the app’s strings. These app strings will come in handy soon, since they will be used for some of the IDs on our app’s elements; which will help us locate them more easily.

Finding Elements

Within each element of the list, notice their properties — things like text and id. This is the kind of information we will want to reference in order interact with the app.

Let’s take the first element for example.

android.widget.TextView (0)
  text: API Demos
  id: android:id/action_bar_title
  strings.xml: activity_sample_code

In order to find that element and interact with it, we can search for it by text or by id.

> text('API Demos')
...
#
> id('android:id/action_bar_title')
...
#

We’ll know that we successfully found an element when we see a Selenium::WebDriver::Element object returned.

It’s worth noting that in the underlying gem that enables this REPL functionality, if we end our command with a semi-colon it will not show us the return object.

> text('API Demos')
# displays returned value

> text('API Demos');
# returned value not displayed

To verify we’ve found the element we expect, let’s access the name attribute for it.

> text('API Demos').name
...
"API Demos"

Finding Elements by ID

A better approach to find an element would be to reference its ID, since it is less likely to change than the text of the element.

In Android, there are a two types of IDs you can search with — a resource ID, and strings.xml. Resource IDs are best. But strings.xml are a good runner-up.

android.widget.TextView (10)
  text, desc: Text
  id: android:id/text1
  strings.xml: autocomplete_3_button_7

This element has one of each. Let’s search using each with the id command.

# resource ID
> id('android:id/text1')
...
#

# strings.xml
> id('autocomplete_3_button_7')
...
#

You can see a more thorough walk through of these commands here. For a full list of available commands go here.

Ending the session

In order to end the console session, input the x command. This will cleanly quit things for you. If a session is not ended properly, then Appium will think it’s still in progress and block all future sessions from working. If that happens, then you need to restart the Appium server by clicking Stop and then Launch in the Appium GUI.

x only works within the console. In our test scripts, we will use driver.quit to kill the session.

Using An Inspector

With the Appium Ruby Console up and running, we also have access to the Appium Inspector. This is another great way to interrogate our app to find locators. Simply click the magnifying glass in the top-right hand corner of the Appium GUI (next to the Launch button) to open it. It will load in a new window.

Once it opens, you should see panes listing the elements in your app. Click on an item in the left-most pane to drill down into the elements within it. When you do, you should see the screenshot on the right-hand side of the window auto-update with a red highlight around the newly targeted element.

You can keep doing this until you find the specific element you want to target. The properties of the element will be outputted in the Details box on the bottom right-hand corner of the window.

It’s worth noting that while the inspector works well for iOS, there are some problem areas with it in Android at the moment. To that end, the Appium team encourages the use of uiautomatorviewer (which is an inspector tool provided by Google that provides similar functionality to the Appium inspector tool). For more info on how to set that up, read this.

For older Android devices and apps with webviews, you can use the selendroid inspector. For more information on, go here.

There’s loads more functionality available in the inspector, but it’s outside the scope of this post. For more info I encourage you to play around with it and see what you can find out for yourself.

Outro

Now that we know how to locate elements in our app, we are ready to learn about automating some simple actions and putting them to use in our first test.

Read:  Chapter 1 | Chapter 2

About Dave Haeffner: Dave is a recent Appium convert and the author of Elemental Selenium (a free, once weekly Selenium tip newsletter that is read by thousands of testing professionals) as well as The Selenium Guidebook (a step-by-step guide on how to use Selenium Successfully). He is also the creator and maintainer of ChemistryKit (an open-source Selenium framework). He has helped numerous companies successfully implement automated acceptance testing; including The Motley Fool, ManTech International, Sittercity, and Animoto. He is a founder and co-organizer of the Selenium Hangout and has spoken at numerous conferences and meetups about acceptance testing.

Follow Dave on Twitter – @tourdedave

Updates Coming to Default Selenium and Chrome Versions on Sauce (August 2)

On Saturday, August 2nd, we will update our Selenium and Chrome default versions to meet current, stable implementations. This update affects users that run automated Selenium tests on Sauce.

Default versions of Selenium and Chrome are used only for tests that don’t have a specified browser version. Users who choose to assign Selenium and Chrome versions to their tests will remain unaffected.

Below you’ll find more details about the updates.

Selenium

Currently the default Selenium version is 2.30.0. Following the update on August 2, the new default Selenium version will be 2.42.2. We advise you to test the new version (2.42.2) in advance using the following desired capability:

"selenium-version": "2.42.2"


If you run into any issues with the new default, note you can continue using the previous version (2.30.0) after Saturday by making the test request the selenium-version desired capability referred to below:

"selenium-version": "2.30.0"


Chrome

Currently the default Chrome versions are Chrome 27 and Chromedriver 1. Following the update on August 2, the new default Chrome versions will be Chrome 35 and Chromedriver 2.10. We advise you to test the new versions (Chrome 35, Chromedriver 2) in advance using the following desired capabilities:

"browserName": "chrome"
"version": "35"


By requesting Chrome 35, Chromedriver 2.10 will be used automatically.


If you run into any issues with the new default, you can continue using the previous versions (Chrome 27, Chromedriver 1) after Saturday by making the test request the “version” desired capabilities referred to below:

"browserName": "chrome"
"version": "27"


Troubleshooting Issues

If you see any issues after moving your tests to these new versions, we suggest checking for known issues on https://code.google.com/p/selenium/issues/list or contacting the Chromedriver and Selenium user groups.

Happy testing!

Announcing Support For Android 4.4 (KitKat)

Hungry for moar Android? We thought so. kitkat

Announcing Sauce Labs support for Android 4.4 (KitKat)! Now you can test mobile web apps with Selenium Webdriver and native and hybrid apps with Appium using our Android emulators. Nom!

Before you start testing, there are a couple of caveats you should know about:

A. When an Android 4.4. emulator is in landscape mode, its apps are unable to recognize the orientation [1]. Further, while the Android 4.4 emulator looks like it’s in landscape mode, apps will not rotate to reflect this. At this time, there is no known workaround.

B. Certain Appium test runs on Android 4.4 emulators will error out when the Selenium `clear` command is sent [2]. This will only affect test runs that end up using the Selendroid testing framework under the hood [3]. The accepted workaround until a fix can be landed is, instead of using the `clear` command, use the `sendKeys` command, and send multiple DELETE (backspace) keys to clear out any text fields.

Can’t wait to get testing? Visit https://saucelabs.com/platforms to get started now.

Sauce + KitKat FTW.

[1] https://code.google.com/p/android/issues/detail?id=61671
[2] https://github.com/appium/appium/issues/3186
[3] https://github.com/selendroid/selendroid/issues/492

sauce_supports_android_4_4_kitkat

Announcing Cloud9 Preview: Instantly Preview Your Cloud9 Project In Any Browser (Powered by Sauce Labs)

Sauce + C9 IntegrationToday our friends at Cloud9 have released a brand new version of their powerful Cloud9 Development Environment, the web-based IDE that gives you unlimited flexibility to develop and test your applications directly from your browser.

As part of this release, we’re excited to announce an integration that we’ve been working on together for a while—the ability to instantly check out the site or app you’re developing in any desktop or mobile browser that Sauce Labs supports, directly in the Cloud9 interface.

Cloud9 has always given you the ability to easily preview the site you’re working on using your current browser. For example, in the screenshot below, you can see the preview window conveniently located where you can work on your code and see the changes reflected immediately:

cloud9 screenshot 1

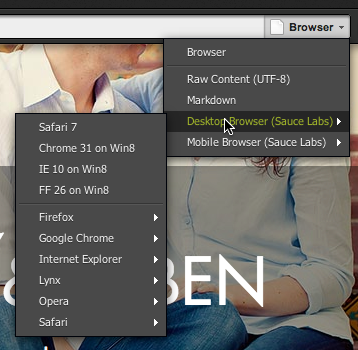
Our integration simply adds another option to the drop-down menu to the right of the URL bar in the preview pane. If you click “Browser”, you’ll see additional options (it even remembers the last four browsers you used for quick access):

c9browsers

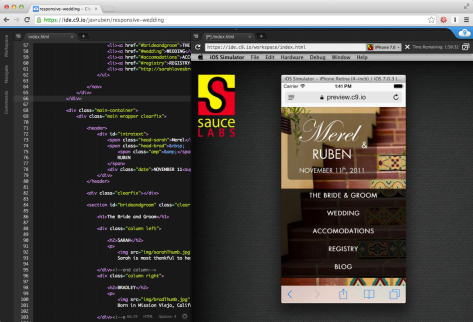
You can select any of our desktop or mobile browsers right from this interface. And if you’re already logged in to Sauce Labs, you’ll see the browser loading immediately. Now you can see whether your “responsive” website actually works as expected on, say, an iPhone Simulator, without ever leaving your IDE:

c9+saucelabs

We think this integration opens up a ton of possibilities for your development workflow, and are proud to be a part of the web-based IDE revolution with Cloud9. Check it out and let us know what you think!

Adding Custom Methods to Data Models with Angular $resource

Sauce Labs software developer Alan Christopher Thomas and his team have been hard at work updating our stack. He shared with us some insight into their revised dev process, so we thought we’d show off what he’s done. Read his follow-up post below.

Thanks for your great feedback to this post. Previously we examined three different approaches to modeling data in AngularJS. We’ve since incorporated some of your feedback, so we wanted to share that information here. You can also see updates we made in our original post.

One of our commenters made mention of a cleaner approach to adding custom methods to $resource models when our API response response allows it, using angular.extend().

In this implementation, we’re imagining an API response that looks like this:

[
  {
    "breakpointed": null,
    "browser": "android",
    "browser_short_version": "4.3",
    ...
  },
  {
    ...
  }
  ...
]

Each of the response objects in the list is a “Job” that contains a whole lot of metadata about an individual job that’s been run in the Sauce cloud.

We want to be able to iterate over the jobs to build a list for our users, showing the outcome of each: “Pass,” “Fail,” etc.

Our template looks something like this:

{{ job.getResult() }} {{ job.name }}

Note the job.getResult() call. In order to get this convenience, however, we need to be able to attach a getResult() method to each Job returned in the response.

So, here’s what the model looks like, using Angular $resource:

angular.module('job.models', [])
    .factory('Job', ['$resource', function($resource) {
        var Job = $resource('/api/jobs/:jobId', {
            full: 'true',
            jobId: '@id'
        });

        angular.extend(Job.prototype, {
            getResult: function() {
                if (this.status == 'complete') {
                    if (this.passed === null) return "Finished";
                    else if (this.passed === true) return "Pass";
                    else if (this.passed === false) return "Fail";
                }
                else return "Running";
            }
        });

        return Job;
    }]);

Note that since each resulting object returned by $resource is a Job object itself, we can simply extend Job.prototype to include the behavior we want for every individual job instance.

Then, our controller looks like this (revised from the original post to make use of the not-so-obvious promise):

angular.module('job.controllers', [])
    .controller('jobsController', ['$scope', '$http', 'Job', function($scope, $http, Job) {
        $scope.loadJobs = function() {
            $scope.isLoading = true;
            var jobs = Job.query().$promise.then(function(jobs) {
                $scope.jobs = jobs;
            });
        };

        $scope.loadJobs();
    }]);

The simplicity of this example makes $resource a much more attractive option for our team’s data-modeling needs, especially considering that for simple applications, custom behavior isn’t incredibly unwieldy to implement.

– Alan Christopher Thomas, Software Developer, Sauce Labs

Appium Bootcamp – Chapter 2: The Console

appium_logoThis is the second post in a series called Appium Bootcamp by noted Selenium expert Dave Haeffner. To read the first post, click here.

Dave recently immersed himself in the open source Appium project and collaborated with leading Appium contributor Matthew Edwards to bring us this material. Appium Bootcamp is for those who are brand new to mobile test automation with Appium. No familiarity with Selenium is required, although it may be useful. This is the second of eight posts; a new post will be released each week.

Configuring Appium

In order to get Appium up and running there are a few additional things we’ll need to take care of.

If you haven’t already done so, install Ruby and setup the necessary Appium client libraries (a.k.a. “gems”). You can read a write-up on how to do that here.

Installing Necessary Libraries

Assuming you’ve already installed Ruby and need some extra help installing the gems, here’s what you to do.

  1. Install the gems from the command-line with gem install appium_console
  2. Once it completes, run gem list | grep appium

You should see the following listed (your version numbers may vary):

appium_console (1.0.1)
appium_lib (4.0.0)

Now you have all of the necessary gems installed on your system to follow along.

An Appium Gems Primer

appium_lib is the gem for the Appium Ruby client bindings. It is what we’ll use to write and run our tests against Appium. It was installed as a dependency to appium_console.

appium_console is where we’ll focus most of our attention in the remainder of this and the next post. It is an interactive prompt that enables us to send commands to Appium in real-time and receive a response. This is also known as a record-eval-print loop (REPL).

Now that we have our libraries setup, we’ll want to grab a copy of our app to test against.

Sample Apps

Don’t have a test app? Don’t sweat it. There are pre-compiled test apps available to kick the tires with. You can grab the iOS app here and the Android app here. If you’re using the iOS app, you’ll want to make sure to unzip the file before using it with Appium.

If you want the latest and greatest version of the app, you can compile it from source. You can find instructions on how to do that for iOS here and Android here.

Just make sure to put your test app in a known location, because you’ll need to reference the path to it next.

App Configuration

When it comes to configuring your app to run on Appium there are a lot of similarities to Selenium — namelythe use of Capabilities (e.g., “caps” for short).

You can specify the necessary configurations of your app through caps by storing them in a file called appium.txt.

Here’s what appium.txt looks like for the iOS test app to run in an iPhone simulator:

[caps]
platformName = "ios"
app = "/path/to/UICatalog.app.zip"
deviceName = "iPhone Simulator"

And here’s what appium.txt looks like for Android:

[caps]
platformName = "android"
app = "/path/to/api.apk"
deviceName = "Android"
avd = "training"

For Android, note the use of both avd. The "training" value is for the Android Virtual Device that we configured in the previous post. This is necessary for Appium to auto-launch the emulator and connect to it. This type of configuration is not necessary for iOS.

For a full list of available caps, read this.

Go ahead and create an appium.txt with the caps for your app (making sure to place it in the same directory as the Gemfile we created earlier).

Launching The Console

Now that we have a test app on our system and configured it to run in Appium, let’s fire up the Appium Console.

First we’ll need to start the Appium server. So let’s head over to the Appium GUI and launch it. It doesn’t matter which radio button is selected (e.g., Android or Apple). Just click the Launch button in the top right-hand corner of the window. After clicking it, you should see some debug information in the center console. Assuming there are no errors or exceptions, it should be up ready to receive a session.

After that, go back to your terminal window and run arc (from the same directory asappium.txt). This is the execution command for the Appium Ruby Console. It will take the caps from appium.txt and launch the app by connecting it to the Appium server. When it’s done you will have an emulator window of your app that you can interact with as well as an interactive command-prompt for Appium.

Outro

Now that we have our test app up and running, it’s time to interrogate our app and learn how to interact with it.

Click HERE to go to Chapter 1.

About Dave Haeffner: Dave is a recent Appium convert and the author of Elemental Selenium (a free, once weekly Selenium tip newsletter that is read by thousands of testing professionals) as well as The Selenium Guidebook (a step-by-step guide on how to use Selenium Successfully). He is also the creator and maintainer of ChemistryKit (an open-source Selenium framework). He has helped numerous companies successfully implement automated acceptance testing; including The Motley Fool, ManTech International, Sittercity, and Animoto. He is a founder and co-organizer of the Selenium Hangout and has spoken at numerous conferences and meetups about acceptance testing.

Follow Dave on Twitter – @tourdedave

Campus Explorer Reduces Testing Time From 72 Hours to 72 Minutes Using Sauce Labs

We sat down with Senior QA Manager Sage Rimal to hear how they use Sauce Labs at Campus Explorer.  Sage shared how they’ve automated their tests on Sauce, and have since reduced their testing time from 72 hours to 72 minutes.

Watch the video below to get the latest!

Want to share your story? We want to hear from you! Submit a request here.